
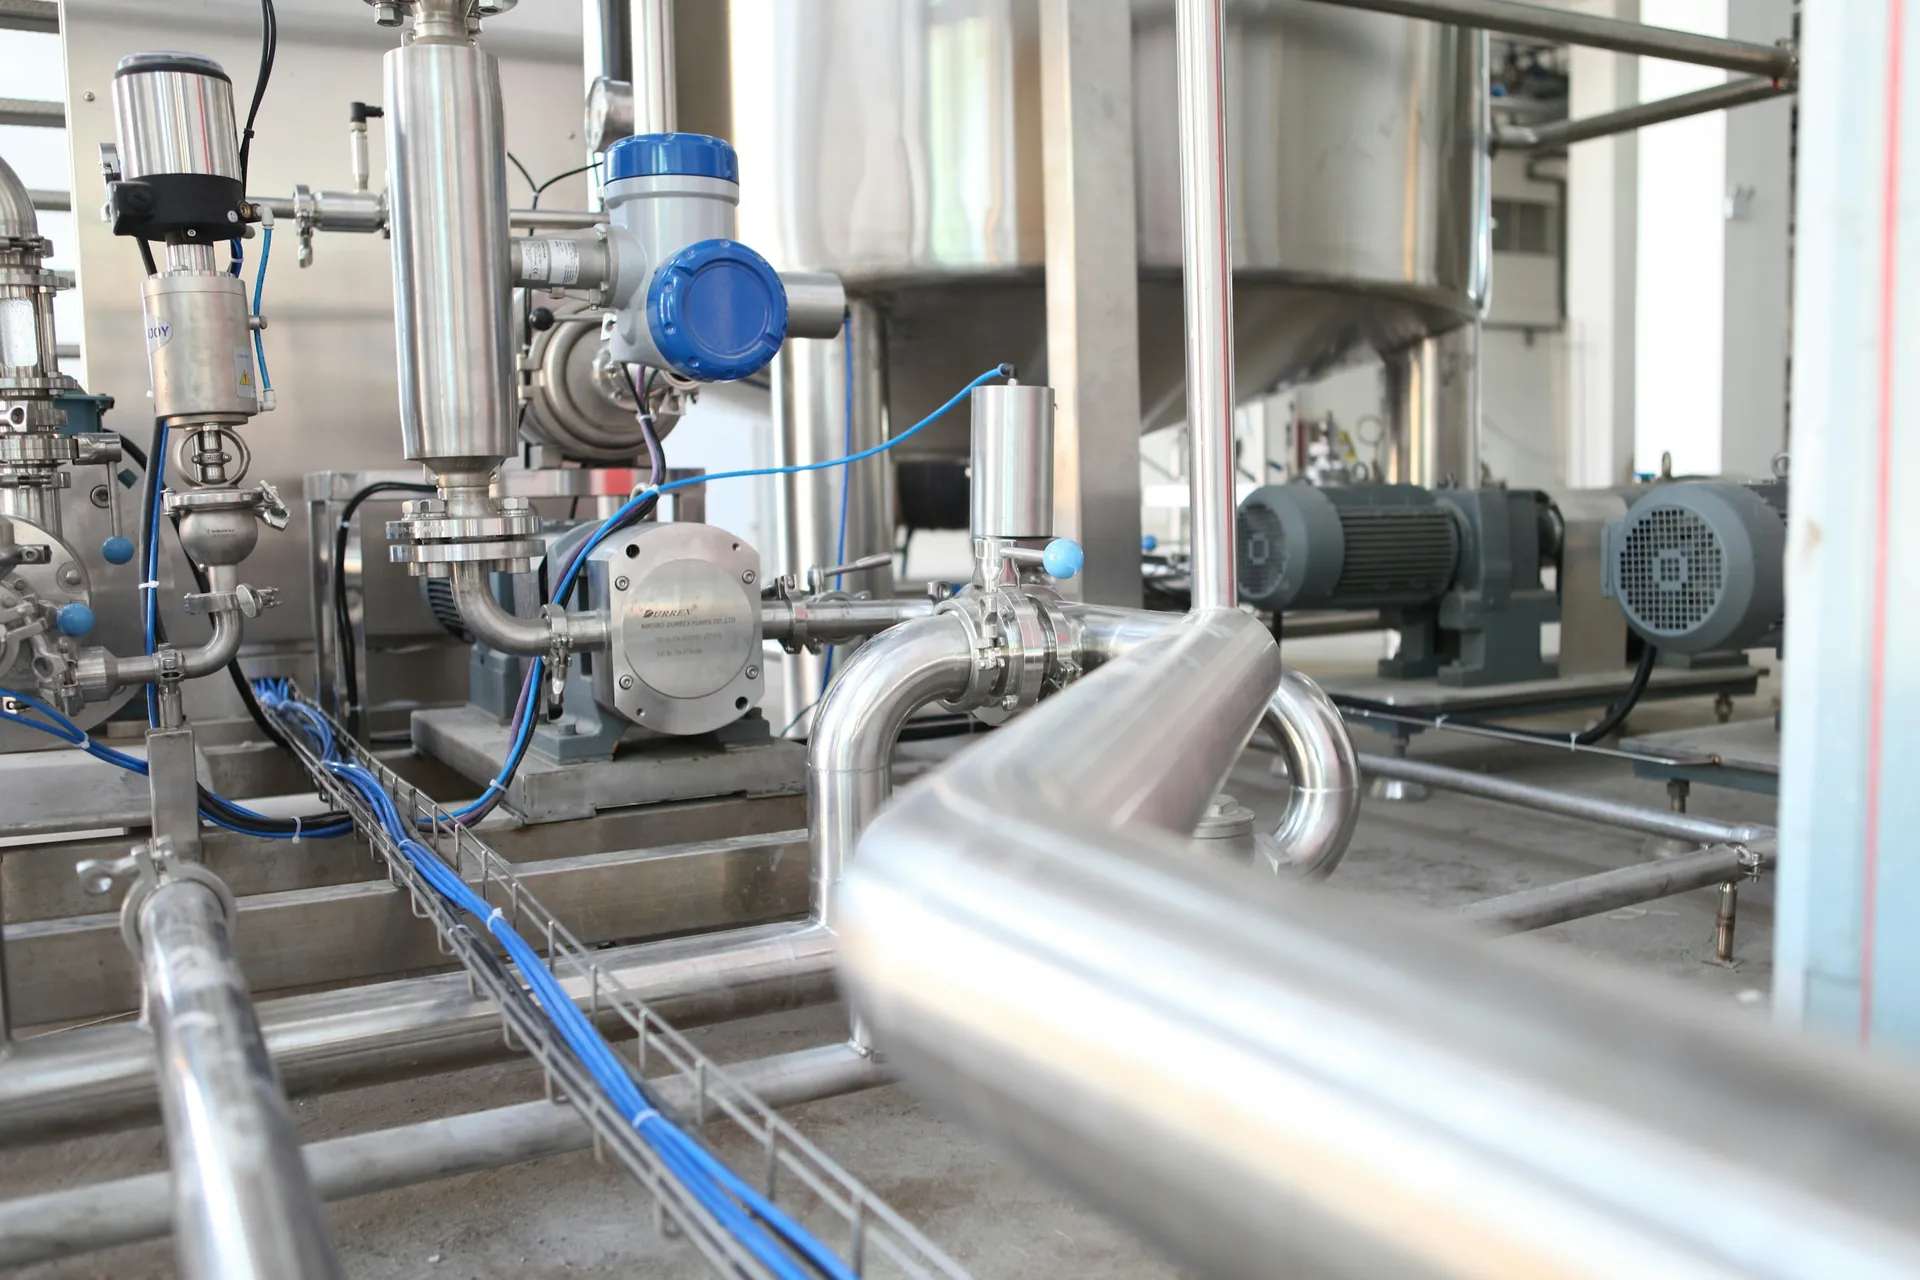
Three ways to maintain a pump
Reactive maintenance repairs equipment after it fails. It is reasonable for non-critical, easily replaced assets, and costly for anything else, because failures arrive at the worst time and often cause secondary damage. Preventive maintenance is triggered by the calendar or by running hours. It reduces surprises but can replace healthy parts and still miss a fault that develops between inspections. Predictive, or condition-based, maintenance acts on the measured condition of the equipment.
Predictive maintenance does not replace the other two. A sensible program uses all three, matched to how critical each asset is. Pumps are good candidates because they are common, they matter, and their degradation leaves measurable traces.
How pumps fail
Understanding failure modes tells you what to measure. For centrifugal pumps, the common ones are:
- Bearing wear or failure: from poor lubrication, contamination, misalignment or overload.
- Mechanical seal leakage: from dry running, misalignment, wear or poor flush conditions.
- Cavitation: vapour bubbles form and collapse when the net positive suction head available falls below what the pump requires, causing noise, vibration, loss of performance and impeller erosion.
- Impeller wear or clogging: abrasion in raw water and grit-laden flows, and ragging in wastewater.
- Imbalance and misalignment: producing vibration that accelerates bearing and seal wear.
- Operation away from the best efficiency point: raising radial loads and shaft deflection.
- Electrical faults: winding insulation breakdown, phase imbalance and overheating in the motor.
- Dry running and deadheading: running without liquid, or against a closed valve, which overheats the pump quickly.
What to measure
| Signal | What it reveals | Notes |
|---|---|---|
| Vibration | Imbalance, misalignment, bearing defects, cavitation | Overall velocity gives severity; frequency spectra help diagnose. The ISO 20816 series offers severity guidance. |
| Temperature | Bearing and winding heating, seal problems | Often a late indicator; vibration usually changes first. |
| Motor current and power | Load changes, electrical imbalance, unusual hydraulic conditions | Inexpensive to obtain, since a drive or starter often already measures it. |
| Suction and discharge pressure | Differential head, cavitation risk, blockage | Low suction pressure warns of cavitation. |
| Flow | Operating point on the pump curve, efficiency | Falling flow at constant speed suggests wear or blockage. |
| Speed, run hours, starts | Context for every other signal | Needed to compare like with like. |
Combining signals is far more informative than any one alone. A rise in current with falling flow points to a different cause than a drop in both.
Pump curves and the best efficiency point
A pump curve shows how head, efficiency, power and required suction head vary with flow at a given speed. The best efficiency point (BEP) is the flow at which the pump runs most efficiently and with the lowest internal loads. Running well to the left of BEP causes recirculation, heating and high shaft loads. Running well to the right risks cavitation and motor overload. A commonly cited preferred operating region is roughly 70–120% of BEP flow, but confirm the figures against the manufacturer's guidance for your pump.
The curve is also a diagnostic tool. As an impeller wears or clearances open up, the pump delivers less head at the same flow and speed. If a pump runs on a variable frequency drive, compare data at the same speed, or normalize it using the affinity laws: flow varies with speed, head with the square of speed, and power with the cube.
Baselines and anomalies
A threshold such as "alarm above 7 mm/s" is useful, but a pump that normally runs at 2 mm/s and creeps to 5 mm/s is already telling you something. That requires a baseline: what normal looks like for this pump, in each operating state. Capture it after commissioning or overhaul, when the pump is known to be healthy.
- Compare like with like. Separate data by speed, flow range and, for outdoor assets, season. A winter baseline in a cold climate may differ from a summer one.
- Trend, not just limits. Rate of change often warns earlier than an absolute value.
- Use peers. A duty pump can be compared with its standby, or with identical pumps in the same station.
- Tier the alerts. Advisory, warning and action levels, each with a named response, prevent alarm fatigue.
Rules or machine learning?
Rules encode known physics and experience: discharge pressure well below the curve at a given flow, low current with low flow suggesting dry running, bearing temperature rising while load is steady. They are transparent, quick to deploy and need no failure history.
Machine learning can learn the normal multivariable behaviour of a pump and flag unusual combinations that no single rule would catch. Unsupervised anomaly detection needs only normal data. Supervised models that predict specific failures need many labelled examples, and most utilities have few, because failures are infrequent and maintenance records are often sparse.
A practical order is rules first, anomaly detection second, and supervised prediction only when the records can support it. Whatever the method, an alert should explain itself: which signals changed, compared with what. Many Canadian municipalities are managing aging pumping assets with limited records, so the quality of maintenance data is often the real constraint on what analytics can do.
Prioritizing maintenance
Monitoring tells you which pump needs attention, but you still have to decide which work comes first. Rank by consequence and likelihood: Is there a standby? What happens if service is interrupted? What are the environmental or compliance consequences of a failure? How long does a repair take, and how hard is access, especially at remote stations in winter? Concentrate the most detailed monitoring on critical pumps without redundancy, and rely on route-based checks and operator rounds elsewhere. Feed alerts into the maintenance management system as work requests, and record what was found, so the next analysis has better evidence. Digitizing the link between each physical asset and its records, for example with RFID tags, makes that history easier to maintain.
Starting small
- Choose a few pumps at one important station, ideally with some failure history.
- Use what exists first: motor current and power from drives or starters, pressures and flow from SCADA. Add bearing temperature and vibration where the failure modes justify it.
- Collect data for long enough to establish baselines across normal operating states.
- Agree on three to five alerts, who receives them and what they should do.
- Review every alert. Adjust limits, retire noisy rules and record outcomes.
- Measure against the baselines you noted at the start: unplanned downtime, emergency work orders and energy per cubic metre pumped.
Only then decide whether to extend the approach to more stations.
Key takeaways
- Match maintenance strategy to criticality; predictive complements preventive; it does not replace it.
- Failure modes decide what to measure: vibration, temperature, current, pressure and flow.
- Use the pump curve and BEP to judge whether a pump is working where it should.
- Baselines by operating state make anomalies visible before limits are reached.
- Start with rules, add anomaly detection, and use supervised models only with enough labelled data.
- Begin by digitizing a few critical pumps and measure results against recorded baselines.