Conventional knowledge, digitized
We pair more than 25 years of process engineering experience with the instrumentation, automation and data tools that digitize a plant and make it easier to see, run and improve. Based in Canada, we serve municipal, community and industrial systems and bring desalination depth from international work.
Know the process first. Then digitize it.
Water plants run on physics, chemistry and biology. Digitalization does not change that. It changes how early you see a drift and how quickly the right person knows.
A coagulant dose that suits one raw-water condition can fail in the next. A biological basin needs oxygen where and when the load demands it. An RO train needs attention long before its permeate quality moves. Operators who understand those relationships can read a trend; operators who only have a number on a local panel are always a step behind.
Our process experience tells us which measurements matter and what normal looks like. Digitization then links those measurements to alarms, dashboards and maintenance records, so the knowledge in an experienced operator’s head becomes something the whole team can see. We start from the plant, not from a product catalogue.
“Do not replace what works. Connect it, extend it and make the data more useful.”
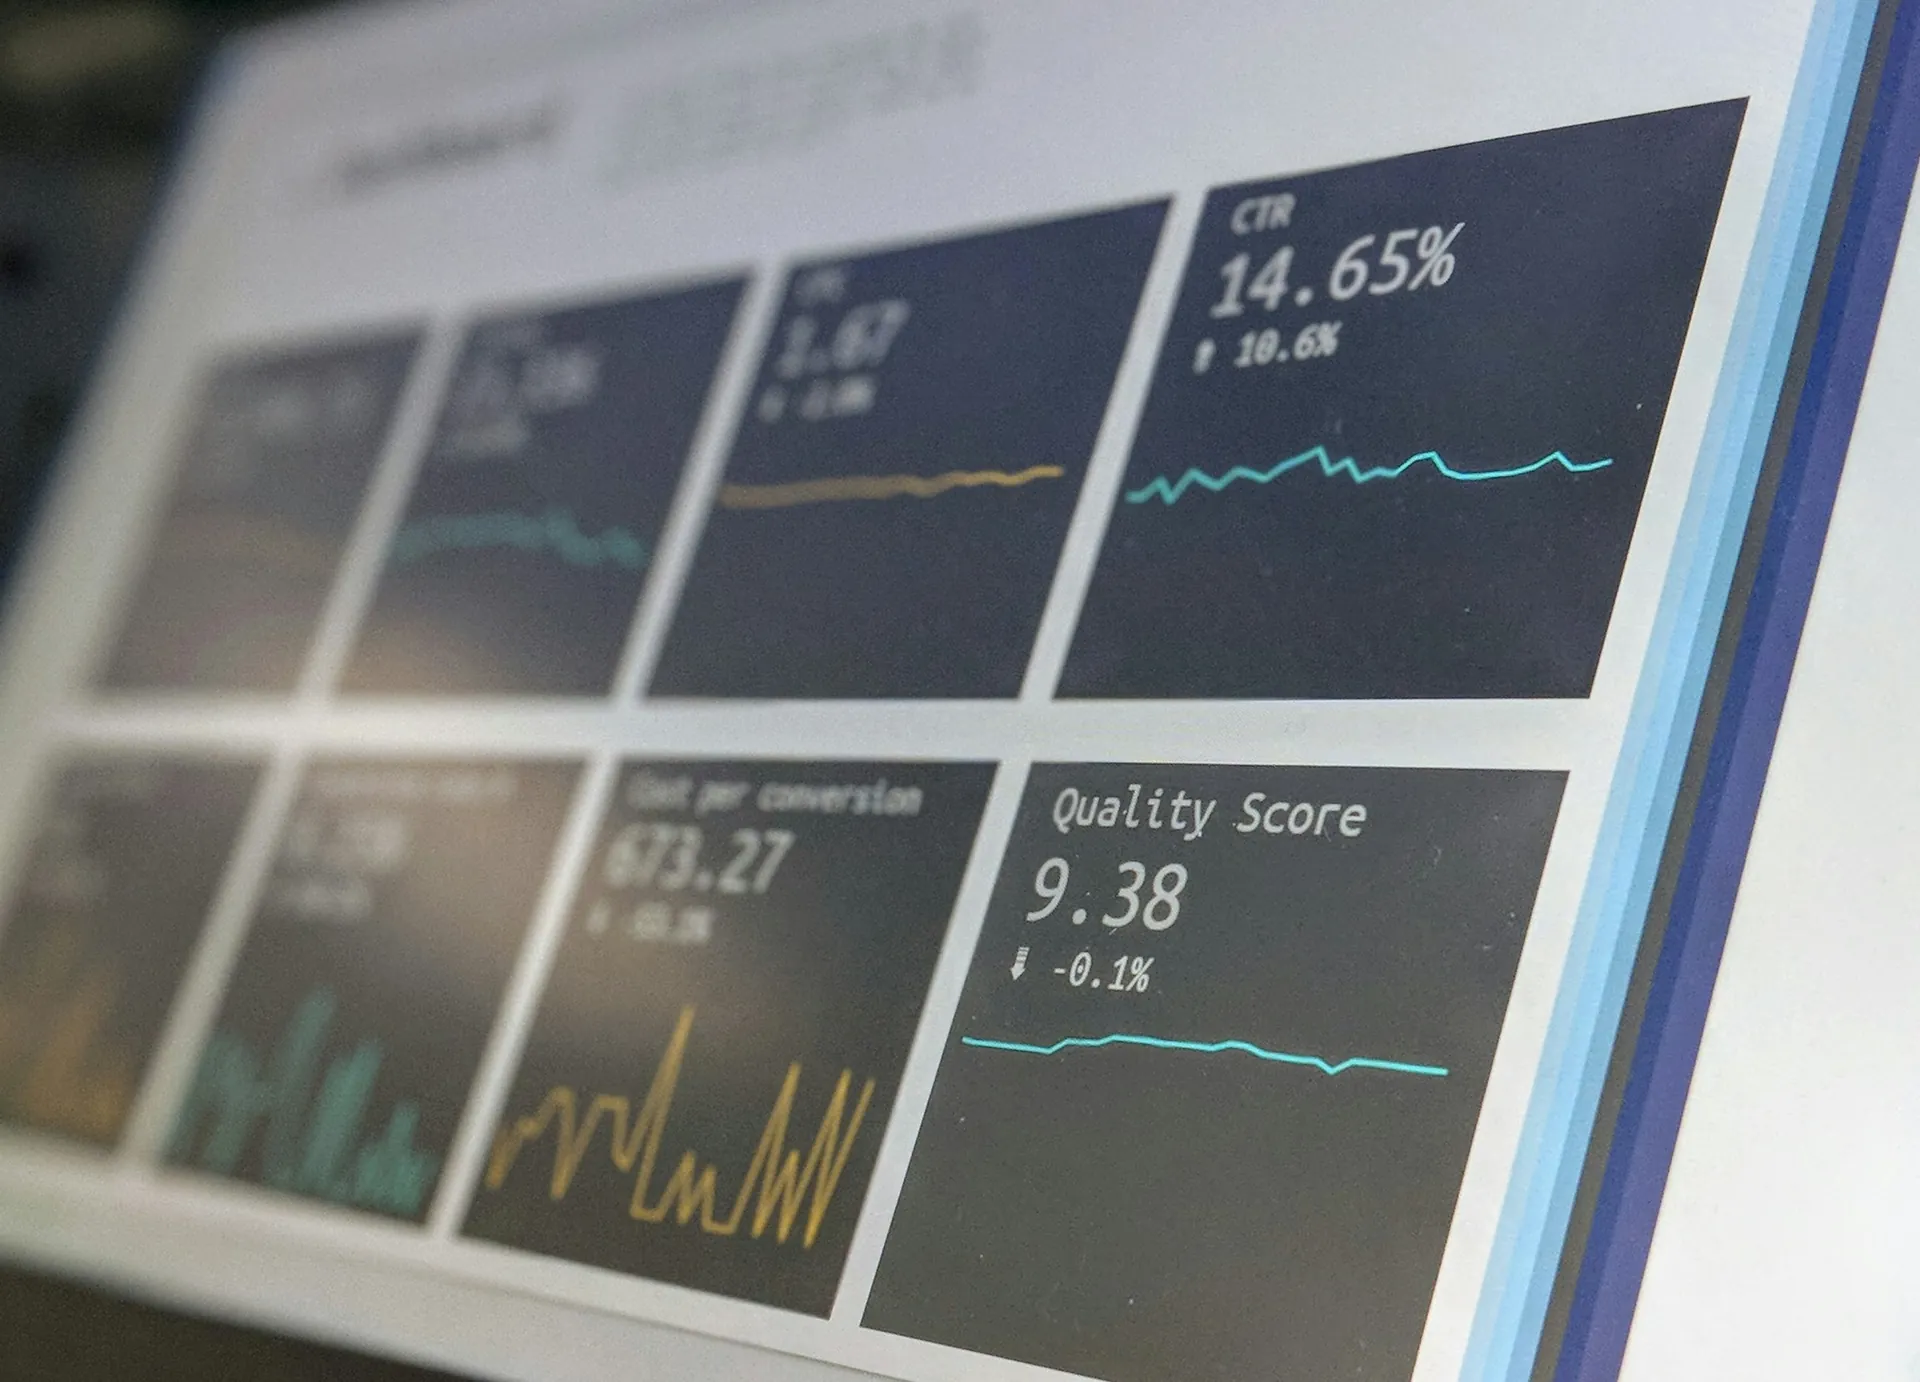
Example values for illustration only. Not data from a FlowVexa installation.
Designed for how Canadian water systems actually run
We are based in Calgary, and our primary focus is Canadian municipalities, water utilities, small and remote communities, and industrial and energy operators, particularly in Western Canada. The process fundamentals are universal. The operating conditions are not.
Cold climate
Cold raw water slows coagulation, settling and biological activity, and winter changes what a plant needs from its operators. Freeze protection for instruments, sample lines and chemical systems is part of the design.
Long distances
Wells, reservoirs, lift stations and treatment sites can be hours apart. Digitizing those sites, with remote monitoring and alarm routing, means the first sign of a problem does not depend on someone driving past.
Aging infrastructure
Many systems combine decades-old equipment with newer additions. We digitize what is installed, adding instrumentation and data where it pays back, and avoid replacing equipment that still does its job.
Reporting and people
Operators answer to provincial drinking-water and wastewater requirements, including regulatory reporting and operator certification. Reliable logged data and well-trained teams make that work easier. Specific requirements vary by province and by system.
Small and remote systems, including rural and Indigenous community systems, often run with lean staffing and long response times. Practical remote visibility and clear operator tools matter most there. We aim to work respectfully and in partnership with the communities and operators who run these systems.
Where we work
Each area has its own process train, its own failure modes and its own set of measurements worth watching and digitizing. Select a tab to see how we approach it.
Water treatment: from raw source to safe supply
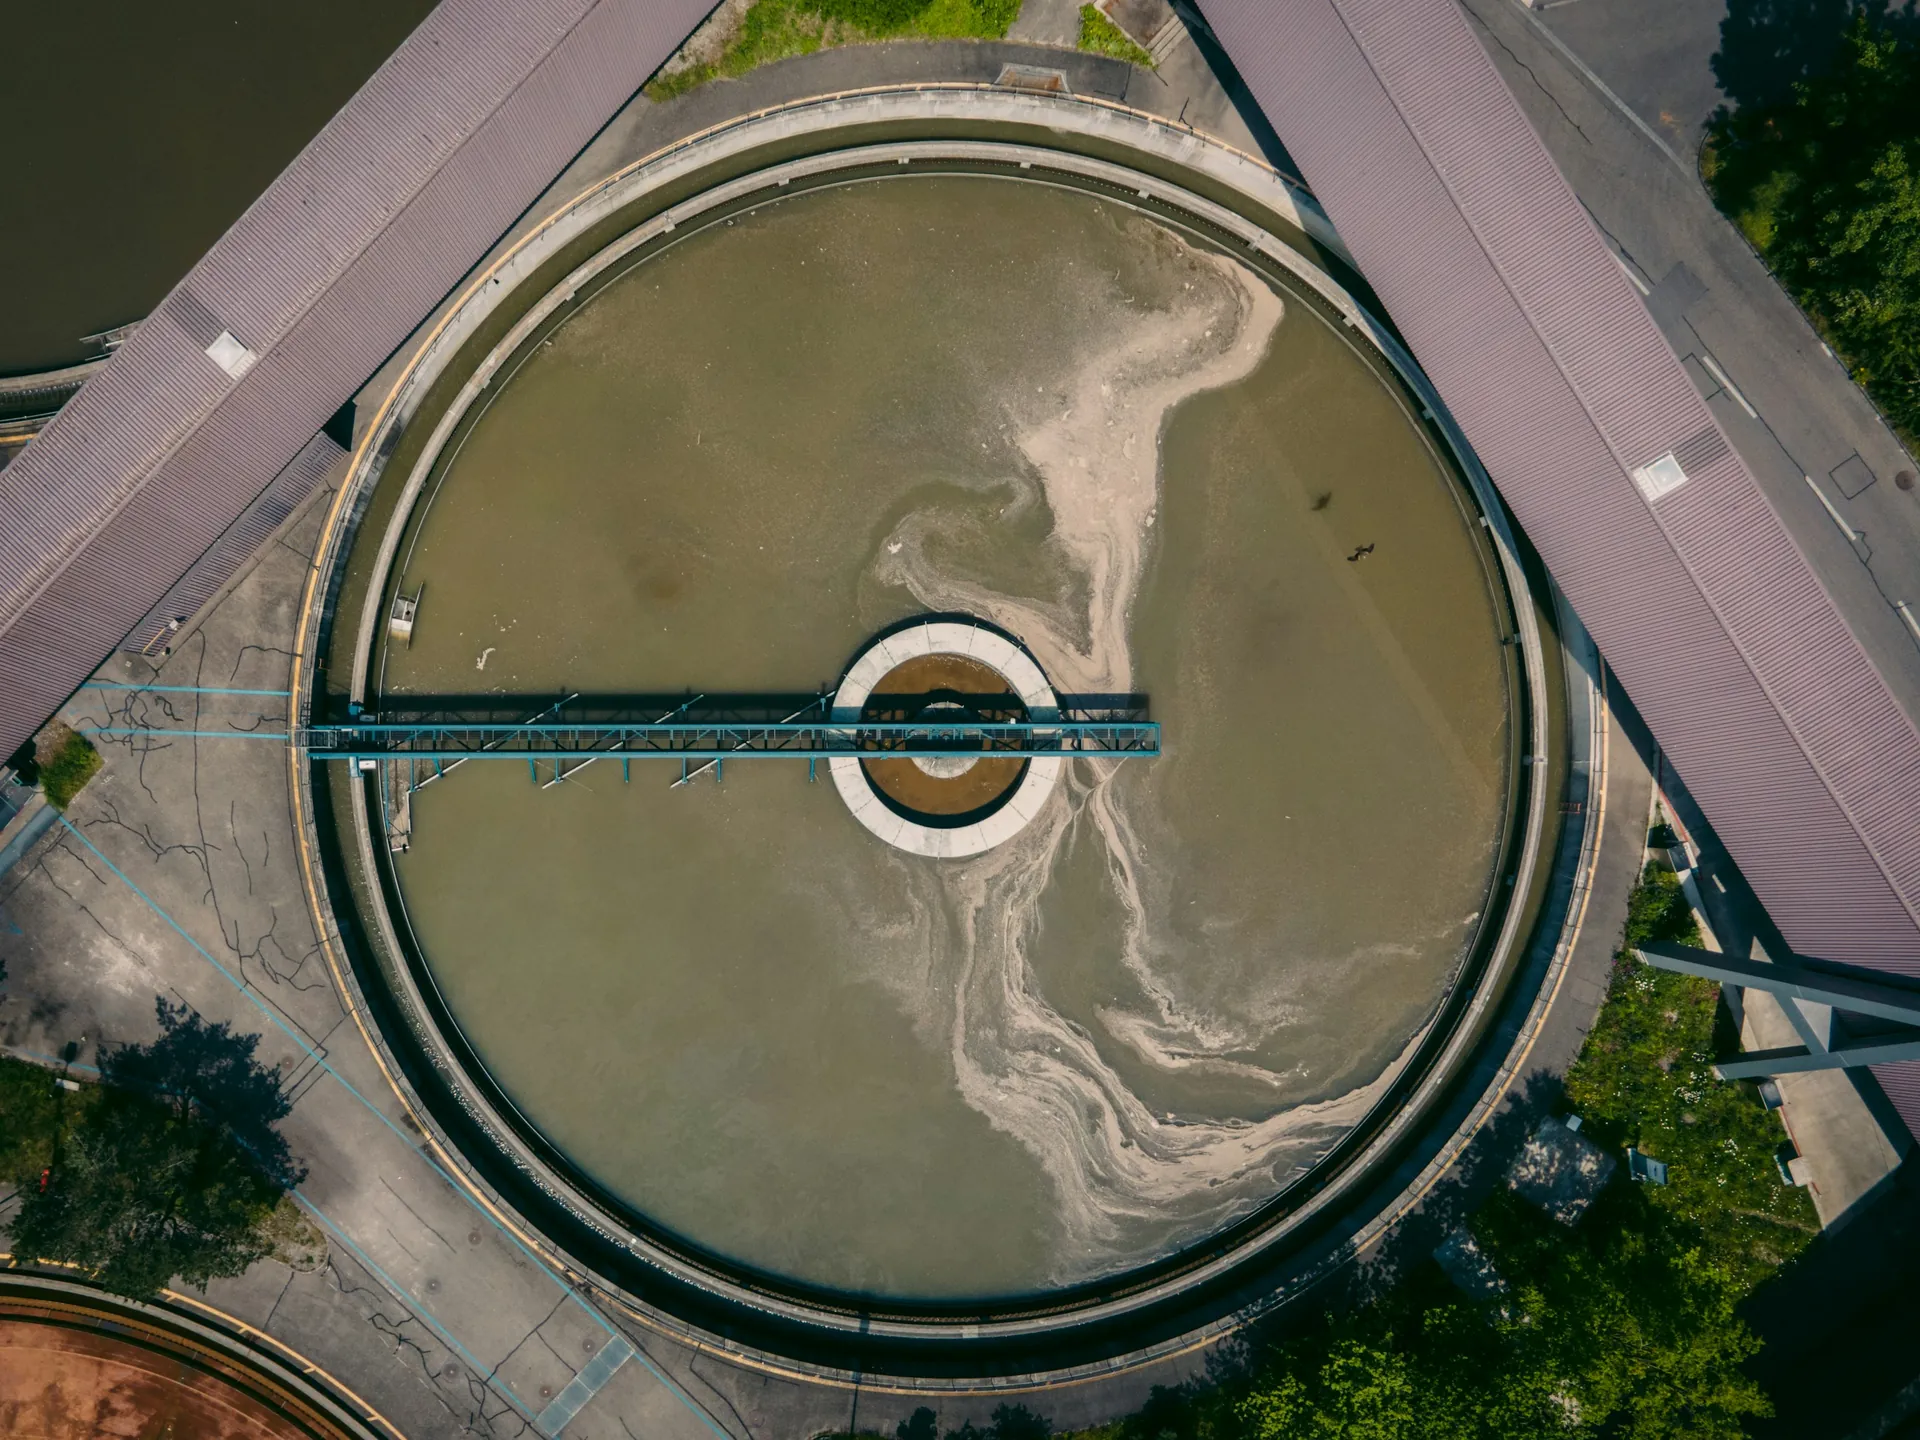
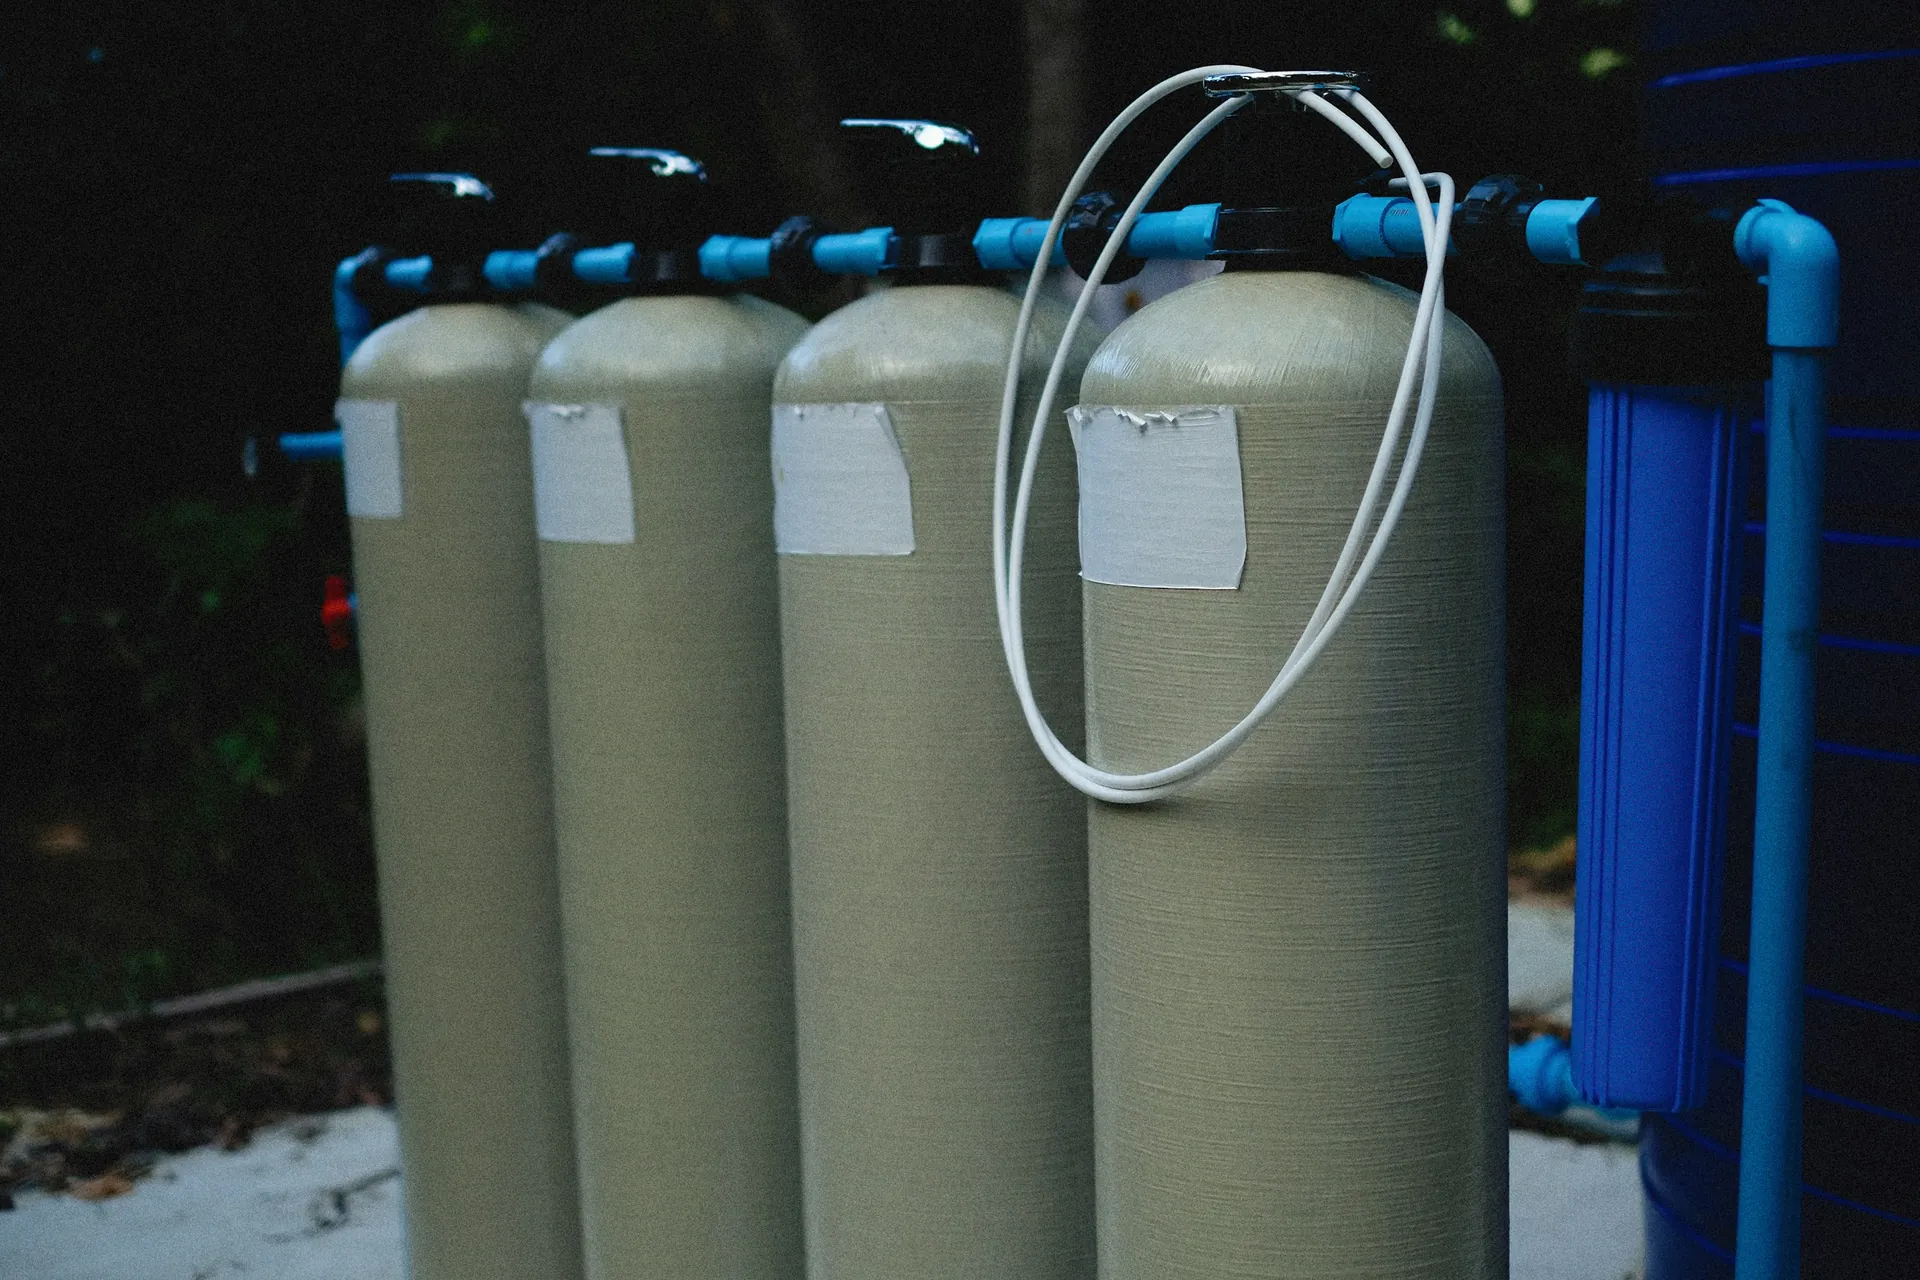
A treatment plant is a series of barriers. Coagulation and flocculation gather fine particles into settleable floc, clarification removes most of it, filtration polishes what remains, and disinfection controls pathogens while a residual protects the water through storage and distribution. Groundwater and industrial sources change the front end, with aeration, oxidation or membrane steps in place of conventional clarification, but the logic is the same: each stage prepares the water for the next.
Our engineering background covers conventional and advanced water treatment, including filtration, chemical dosing and pumping systems. The practical difficulty is rarely the flow sheet. It is that raw water does not hold still. Rainfall, season, algae and upstream activity change turbidity, organics and chlorine demand, and a plant tuned for last week’s water drifts. Good instrumentation and clear data let operators see the change early and respond while the process still has margin.
Our experience covers
- Water treatment plants
- Filtration
- Chemical dosing
- Pumping systems
- Industrial water treatment
- Water quality monitoring
- Instrumentation
- Automation
- SCADA
- Remote monitoring
Typical operator challenges
- Raw-water quality that shifts faster than grab-sample dosing can follow, including spring runoff and cold-water conditions that change coagulation
- Filter backwashes triggered by a timer rather than by head loss or breakthrough
- Chlorine residual that is hard to hold at the far end of the network
- Small, remote or lightly staffed systems where an alarm reaches the operator late and a site visit is a long drive
- Control panels that already log data that nobody outside the plant can see
- Pumping energy and chemical use reviewed monthly instead of in real time
What we monitor and why it matters
| Parameter | Why it matters |
|---|---|
| Raw and settled-water turbidity | First indicator of a change in source water. Guides coagulant dose and shows how well the clarifier is working. |
| pH | Coagulation performs within a narrow pH window. pH also affects disinfection efficiency and corrosion in the network. |
| Filter turbidity and head loss | Turbidity from each filter shows breakthrough early. Head loss shows when a filter needs a backwash, so the decision does not rest on a timer. |
| Free chlorine residual (and ORP where used) | Confirms that disinfection is working and that a protective residual is carried through storage and distribution. |
| Clear-well level, flow and pump status | Balances production against demand and protects pumps from running dry and tanks from overflowing. |
| Chemical tank levels and dosing flow | Prevents running out of coagulant or disinfectant, and exposes over- or under-dosing. |
The digital layer
Online turbidity, pH and chlorine analyzers, plus level and flow instruments, feed the plant PLC. SCADA gives operators trends and alarms in one place, remote monitoring puts the same view in front of an on-call engineer, and digital O&M records tie chemical use, pump hours and filter runs to the water produced. Logged data also supports the regulatory reporting that provincial drinking-water programs require. Where a plant already has this equipment, we start by connecting and organizing what is there.
- Online analyzers
- Dosing control
- Filter monitoring
- Pump monitoring
- Energy monitoring
- SCADA
- Remote monitoring
Wastewater: conventional knowledge, modern technology
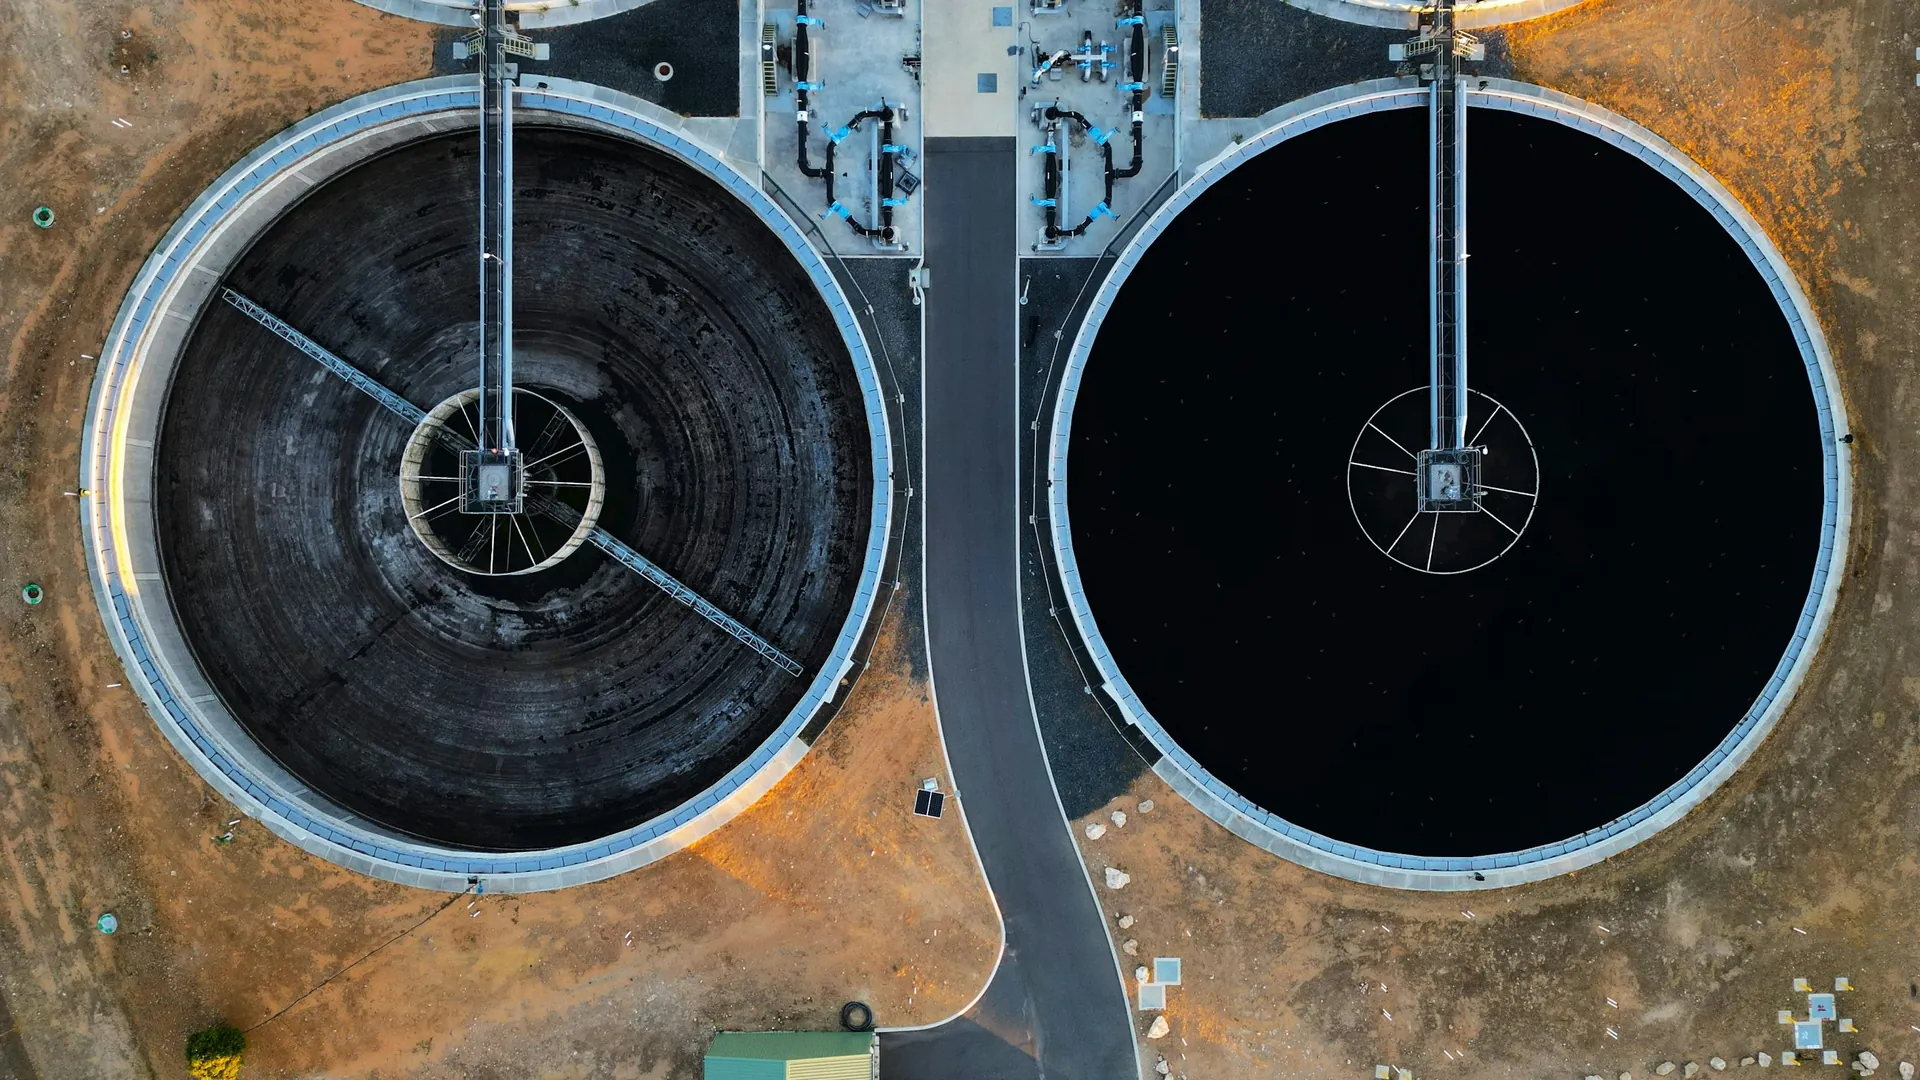
Municipal and industrial wastewater plants do the same basic job: remove solids, convert dissolved organics and nutrients with biology, separate the biomass from the treated water, and polish the effluent to meet a discharge permit or a reuse specification. Screening and grit protect the plant, primary settling takes out the easily settled solids, and the biological stage does the heavy lifting, whether that is conventional activated sludge, a moving-bed biofilm reactor (MBBR) or a membrane bioreactor (MBR), which replaces the secondary clarifier with membranes.
Our wastewater experience includes municipal and industrial treatment, biological treatment, MBBR, MBR and water reuse. A biological process is a living system. It responds to load, temperature, toxic shocks and oxygen supply, and it is usually the largest energy user on site, mostly through aeration. Reliable process monitoring gives operators the visibility to keep the biology healthy and to spend aeration energy only where it is needed.
Our experience covers
- Conventional wastewater treatment
- Municipal WWTP / STP
- Industrial wastewater
- Biological treatment
- MBBR
- MBR
- Water reuse
- Process monitoring
- Instrumentation
- Automation
- Energy optimization
- Digital O&M
Typical operator challenges
- Load swings from industrial discharges, stormwater, spring melt or seasonal population
- Cold-weather performance, where low temperatures slow nitrification and settling, and small lagoon or package systems have limited instrumentation
- Over-aeration because dissolved oxygen is controlled by hand or fixed setpoints
- Poor settling, or an unclear picture of sludge age and return rates
- MBR membrane fouling noticed only when transmembrane pressure climbs
- Effluent quality known only from periodic laboratory results
- Lift stations spread over long distances with limited telemetry, and effluent reporting that depends on manual records
What we monitor and why it matters
| Parameter | Why it matters |
|---|---|
| Dissolved oxygen (DO) | Too little starves the biology; too much wastes aeration energy. DO feedback lets blowers follow actual demand. |
| MLSS / MLVSS (biomass concentration) | Shows how much active biomass the basin holds, which sets sludge age and the balance between food and microorganisms. |
| Ammonia and nitrate (where measured) | Show nitrification and denitrification performance and support more precise aeration control. |
| Sludge blanket level and return flow | Tell operators whether the clarifier is holding its solids and whether RAS rates are right. |
| Transmembrane pressure and permeability (MBR) | Give early warning of membrane fouling, so cleaning can be planned rather than triggered by a loss of flux. |
| Effluent turbidity, UV transmittance, chlorine residual | Confirm that tertiary treatment and disinfection meet the permit or the reuse specification. |
| Blower power and pump runtime | Aeration is usually the largest energy user, so energy per cubic metre treated is a core KPI. |
The digital layer
DO, MLSS, level and flow instruments connect to the plant PLC and SCADA, giving a single view of the biological process. Trend data, alarm analysis and energy monitoring support aeration optimization and maintenance planning, while LoRaWAN or cellular telemetry can extend visibility to remote lift stations without rebuilding the existing control system.
- Process monitoring
- Aeration optimization
- Energy monitoring
- Alarm analysis
- Lift-station telemetry
- Digital O&M
- Predictive maintenance
Reverse osmosis and desalination
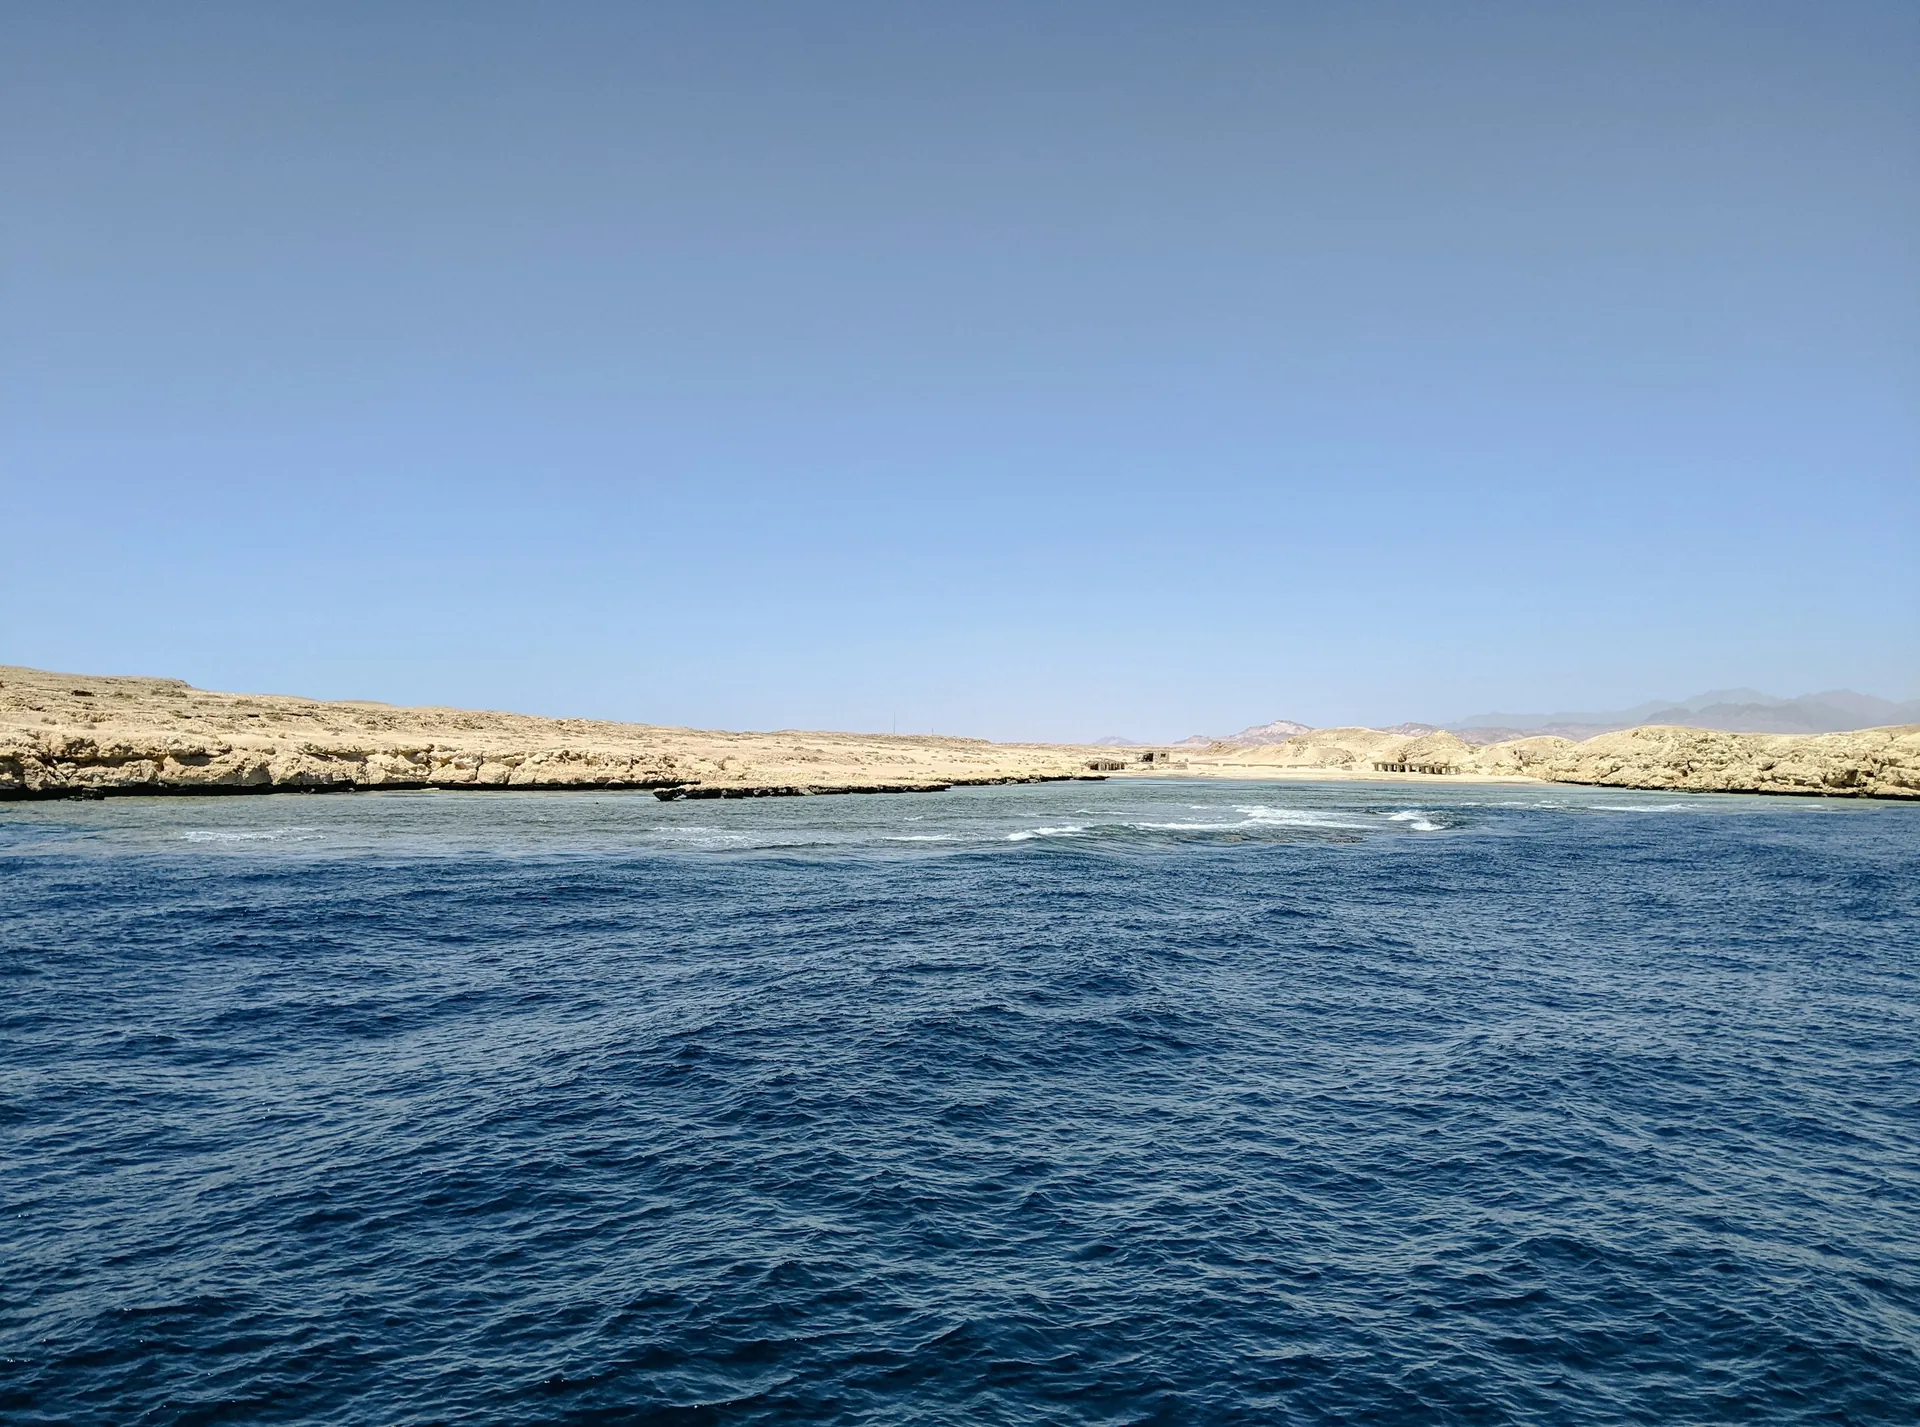
Reverse osmosis pushes water through semipermeable membranes at a pressure above the feed water’s osmotic pressure, leaving most dissolved salts behind in a concentrate stream. Seawater RO (SWRO) treats high-salinity seawater at high pressure. Brackish water RO (BWRO) treats lower-salinity groundwater or surface water at lower pressure and usually higher recovery. Both depend on pretreatment, because membranes are only as reliable as the water that reaches them. Compare SWRO and BWRO.
FlowVexa has extensive professional experience in RO and desalination applications, including seawater and brackish-water systems, pretreatment, membrane systems and maintenance activities across multiple desalination facilities. This is where our international experience is deepest: our founder’s years in the Saudi market give us a practical understanding of how seawater and brackish plants are built and run. We bring that depth to Canadian applications, where brackish-water RO, industrial process water and reuse are the more common needs, and to international projects such as the Port Sudan Water Initiative, a proposed 50,000 m³/day SWRO project that is in development.
Our experience covers
- Seawater reverse osmosis (SWRO)
- Brackish water reverse osmosis (BWRO)
- Pretreatment
- Membrane systems
- Pressure monitoring
- Flow monitoring
- Conductivity / TDS monitoring
- Energy monitoring
- Chemical dosing
- RO performance monitoring
- Automation
- SCADA
- Remote monitoring
Typical operator challenges
- Fouling or scale that builds slowly and shows up as a gradual loss of performance
- Pretreatment upsets from algae blooms or turbidity spikes at the intake
- Raw skid data that is not normalized, so a change in temperature or pressure can look like membrane damage, or hide it
- High specific energy use with limited visibility of where it goes
- Cleaning scheduled by calendar instead of by measured performance
- Chemical dosing (antiscalant, biocide, pH adjustment) that is hard to verify
What we monitor and why it matters
| Parameter | Why it matters |
|---|---|
| Normalized permeate flow | Corrects measured permeate flow for temperature, pressure and salinity, so real membrane performance loss is not confused with a change in operating conditions. |
| Differential pressure (ΔP) by stage | A rising ΔP points to fouling or scaling in the feed channel, often before permeate quality changes. |
| Salt passage and permeate conductivity (TDS) | Show whether the membranes are still rejecting salt and whether product water meets specification. |
| SDI and turbidity at RO feed | Measure how well pretreatment is protecting the membranes. ORP is also monitored where an oxidant must be removed before the membranes. |
| Feed pressure, flow and recovery | Together they define the operating point and flag scaling risk or a membrane stage that needs attention. |
| Specific energy consumption (kWh/m³) | Usually the largest operating cost. Tracked by pump and by train, it guides pump-speed and energy-recovery decisions. |
| Antiscalant and chemical dosing flow | Confirms that scale and fouling control is actually being delivered. |
The digital layer
Pressure, flow and conductivity instruments on each stage feed the PLC and SCADA. Calculated values such as normalized permeate flow, salt passage and specific energy turn raw measurements into trends that show membrane condition and support cleaning and maintenance decisions. Remote monitoring lets specialists review performance without being on site.
- RO performance monitoring
- Normalized data
- Energy monitoring
- Chemical dosing
- SCADA
- Remote monitoring
- Maintenance planning
Industrial water: process, utilities, wastewater and reuse
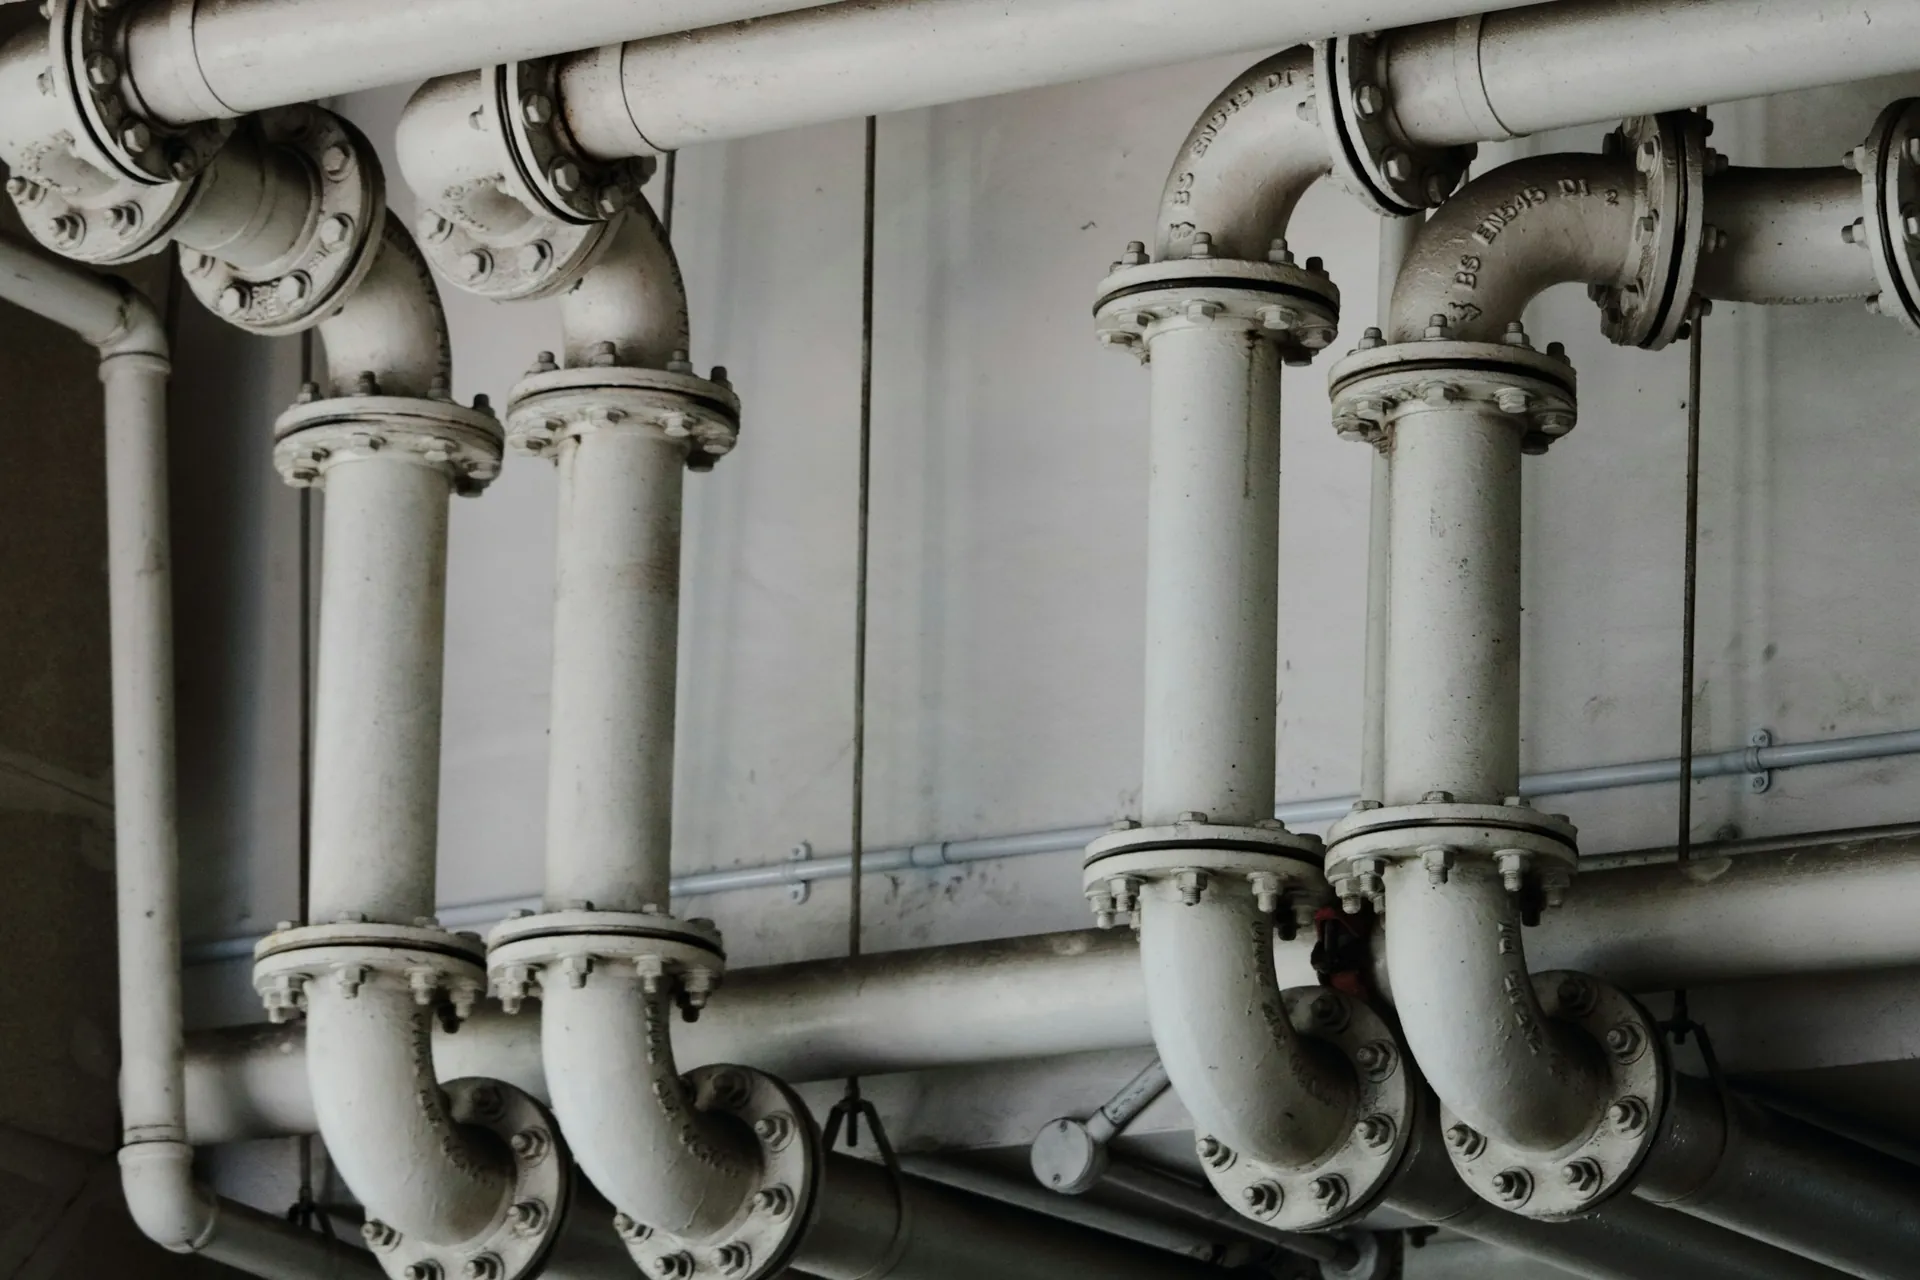
Industrial facilities use water in several ways: as an ingredient or cleaning medium in the process, as boiler feed, as cooling-tower make-up and blowdown, and as a stream that must be treated before it leaves the site. Each use has its own quality requirement, so one site often needs several treatment trains, from filtration and softening through RO and deionization to effluent treatment.
FlowVexa supports industrial water applications from process treatment to monitoring and control, with a particular focus on industrial, oil and gas, and energy operators in Western Canada. That includes process water, RO systems, pretreatment, desalination, chemical dosing and pumping, as well as industrial wastewater and reuse. Cold winters add their own demands, such as heat-traced lines, freeze protection and reliable instruments in unheated buildings. For a plant manager, the questions are usually practical: how much water do we use, where does it go, can any of it be reused, and how do we know the treatment is working before it affects production or a discharge permit?
Our experience covers
- Process water
- Industrial wastewater
- RO systems
- Water reuse
- Filtration
- Pretreatment
- Desalination
- Chemical dosing
- Pumping
- Instrumentation
- Automation
- Digital monitoring
Typical operator challenges
- Boiler and cooling systems where scale, corrosion or biological growth cut efficiency and shorten equipment life
- Wastewater strength and composition that follow the production schedule
- Water metered at the site entrance but not by process area
- Reuse opportunities that are hard to assess without flow and quality data
- Treatment skids from different suppliers, each with its own controller and no shared view
- Discharge permits that call for evidence as well as compliance
What we monitor and why it matters
| Parameter | Why it matters |
|---|---|
| Flow by area | Metering by process, utility and effluent stream shows where water goes and where losses or reuse opportunities sit. |
| Conductivity | Controls cooling-tower cycles of concentration and boiler blowdown, and shows RO or deionization performance. |
| pH and ORP | Guide chemical treatment and the control of corrosion and biological growth, and verify neutralization before discharge. |
| Hardness and silica (where relevant) | Early warning of softener exhaustion or scale-forming conditions in boilers and RO. |
| Wastewater flow, pH, turbidity and organics | Track the load to the effluent plant, protect biological treatment and document compliance with discharge limits. |
| Pump status, runtime and energy | Supports condition-based maintenance and reveals inefficient pumping. |
The digital layer
Instrumentation and PLC data from separate treatment skids can be brought into one SCADA or dashboard view without replacing each skid’s controller. Water-balance dashboards, KPI tracking and alarm management give operations, utilities and environmental teams the same data, and reuse loops can be checked against measured quality.
- Water balance
- KPI dashboards
- Alarm management
- Skid integration
- Remote monitoring
- Reuse verification
SWRO and BWRO: how they differ
Both use the same membrane principle. The feed water sets almost everything else. The ranges below are general figures for orientation, not design values for any particular plant.
| Characteristic | SWRO (seawater) | BWRO (brackish water) |
|---|---|---|
| Typical feed | Seawater, commonly about 30,000 to 45,000 mg/L TDS | Brackish groundwater or surface water, from about 1,000 to roughly 15,000 mg/L TDS |
| Operating pressure | High, commonly about 55 to 70 bar, and higher for very saline feed | Much lower, typically about 10 to 25 bar depending on salinity |
| Recovery (single pass) | Limited by osmotic pressure, often about 40 to 50% | Often much higher, around 75 to 90%, limited mainly by scaling |
| Specific energy | The higher of the two. Modern whole-plant figures are commonly quoted in the range of 3 to 4 kWh/m³ | Substantially lower, usually well under 2 kWh/m³ depending on salinity and pressure |
| Energy recovery | Standard practice. Isobaric devices are widely used | Optional. Considered mainly on larger or higher-salinity plants |
| Main pretreatment concern | Intake quality, suspended solids, algae and biofouling | Scaling (carbonate, sulfate, silica) and iron or manganese |
| Concentrate | Brine at roughly twice the feed salinity, usually returned to the sea through an outfall designed for dispersion | Smaller volume per unit of product but more concentrated in scaling salts. Inland sites often need ponds, injection wells or other disposal routes |
| Monitoring focus | Intake and pretreatment performance, ΔP, energy recovery, specific energy, product quality including boron where specified | Antiscalant dosing, recovery, scaling indices, ΔP by stage, normalized flow |
| Typical use | Coastal municipal supply and large industrial demand | Inland municipal supply, industrial process water, agriculture |
Actual values depend on temperature, feed composition, membrane type, plant configuration and design basis. FlowVexa’s own Port Sudan Water Initiative is a proposed SWRO project in development; see Projects.
Match the water to the job
Not every use needs drinking-water quality. Reuse works when the treatment fits the purpose and someone can prove it.
Greywater is the wastewater from sinks, showers and laundry. It carries far less contamination than toilet or kitchen wastewater, which makes it a practical candidate for irrigation, toilet flushing, cooling-tower make-up or some process uses, provided it is treated to a standard that suits the end use and the rules that apply in that jurisdiction. Treated municipal and industrial effluent can serve similar purposes.
In Canada, reuse tends to come up where discharge limits, water licences or supply constraints make it worth a closer look, for example at industrial sites, data centres and some agricultural operations. Our international experience includes projects in Saudi Arabia involving greywater treatment plants. What that work reinforces is that a reuse system is only as credible as its verification. If operators cannot see turbidity, disinfection residual and flow in real time, they cannot show that the water is fit for its intended use.
- Greywater treatment
- Municipal effluent reuse
- Industrial reuse loops
- Irrigation
- Cooling make-up
Characterize
Understand volumes, sources and variability before choosing a treatment train.
Treat
Biological or membrane treatment plus disinfection, sized for the intended use.
Verify
Online turbidity, chlorine residual and flow, with alarms when quality drifts.
Use and track
Meter the reused water so the offset against fresh supply is visible and reportable.
From plant to dashboard
The same digitalization path applies across all four process areas. Existing instruments and controllers stay in place; we digitize their signals, organize the data and put it in front of the people who act on it, on site or remotely.
Use what is there
Many plants already run working PLC and SCADA systems. We review what they hold, then digitize the gaps with additional instruments, gateways and dashboards.
Open protocols
Modbus, OPC UA, DNP3 and MQTT are common ways to bring field and control data into one place. LoRaWAN extends coverage to remote tanks, pumps and meters.
Connected and protected
More connectivity means more exposure. Segmentation, access control and operational technology awareness are part of the design, not an afterthought.
Frequently asked
Do you replace existing control systems?
Not unless there is a clear reason to. Many facilities already have functioning PLC and SCADA systems. Our approach is to connect and extend them, add instruments where the data has gaps, and make the information more useful to operators, engineers and managers. Replacement is considered when equipment is obsolete, unsupported or unable to meet the requirement.
What is the difference between SWRO and BWRO?
SWRO treats seawater and runs at high pressure with lower recovery and higher energy use. BWRO treats lower-salinity brackish water at lower pressure with higher recovery, and the main concern shifts from biofouling to scaling. The comparison table on this page sets out the general ranges.
Can a plant that is already running be digitized?
Yes. The usual first step is a review of existing instruments and the data the PLC already holds. Many gaps can be closed with additional sensors, gateways and a data platform alongside the existing control system. For remote assets such as tanks, wells or lift stations, which are common in small, rural and remote community systems across Canada, LoRaWAN or cellular telemetry can add visibility without major civil work. Cold-climate installation details, such as enclosure heating and freeze protection, are part of the design.
Which measurements matter most in an activated sludge plant?
Dissolved oxygen, biomass concentration (MLSS), ammonia and nitrate where nitrogen removal is required, sludge blanket level, flow and aeration energy cover most of the decisions an operator makes. The right set depends on the permit, the plant configuration and the existing instruments. See the wastewater tab for how these are used.
Is greywater reuse suitable for any site?
It depends on the volume of greywater available, the quality required, the intended use and local regulation. Our experience includes greywater treatment plants in Saudi Arabia. For a new project, we start by assessing whether the available greywater and the demand for non-potable water are well matched, then design treatment and verification around that end use.
Do you offer operator training?
Yes. FlowVexa Academy offers professional training and workshops covering water treatment, wastewater, RO, desalination, process monitoring, automation and digital water. Programs can be tailored for utilities, industrial teams and universities. Training supports operator development; it does not replace the operator certification that provincial regulators require. See the training tracks.
Talk to a water specialist about digitizing your plant
Whether you run a municipal or community system, an industrial site or an energy facility, and whether you are planning a new treatment train or want to digitize one that already runs, we would be glad to hear about it.